Now we can use folding AI such as Alpha-fold to predict 3D structure of target proteins of course homology modeling is also used to do it. But these structures are snap shot and apo form. So Ligand based drug design(LBDD) Ligand based virtual screening (LBVS) are still important strategy for drug discovery.
Lots of LBVS is based on compound similarity which means similar compounds will have similar biological properties. The metrics of similarity is used not only 2D but also 3D.
Today I would like to try to use the LBVS package which is developed by Healx, AI based drug discovery company.
They shared the code on github. So we can use lig3dlens on MIT lincense.
Let’s prepare test env and write code!
(base) $ mamba create -n lig3dlens python=3.10
(base) $ gh repo clone healx/lig3dlens
(base) $ cd liglens
(base) $ conda activate lig3dlens
(lig3dlens) $ pip install -r requirements.txt -e .
I added ‘-e’ option because I modified original code because there is a bug.
Then I modifield original code slightly shown below. I added following line because original code will failed when the invalid smiles are contained so I modified the part, the code will return None when invalid smiles are given as input and go next molecule.
# lig3dlens/prep_cmpd_library.py

 52       mol = dm.keep_largest_fragment(mol)
 53++     #remove molecules which are not readable for rdkit
 54++     if dm.to_mol(dm.standardize_smiles(dm.to_smiles(mol))) != None:
 55++         row["smiles_sdt"] = dm.standardize_smiles(dm.to_smiles(mol))
 56++         return row
 57++     else:
 58++         return None
After the modification I tried to LBVS with dude-cdk2 dataset.
Lig3Dlens provides simple step for VS.
1) prepare input from SDF >>> lig3dlens-prepare
2) run alginment to reference molecule >>> lig3dlens-align
3) clustering these molecules for picking up >>> lig3dlens-cluster
# get data
(lig3dlens) $ aria2c -x5 https://dude.docking.org//targets/cdk2/cdk2.tar.gz
(lig3dlens) $ tar vxfz cdk2.tar.gz
After getting dataset, I used actives_final.sdf and decoys_final.sdf for testing. Before going to the next step, I added MOL_ID prop to each files because lig3dlens use column which contains ‘ID’ as a key for tracking molecuels. If there are no properties which contain ‘ID’, process will be failed.
# for example
from rdkit import Chem
sdf = Chem.SDMolSupplier('./cdk2/actives_final.sdf')
w = Chem.SDWriter('./cdk2/actives_w_id.sdf')
for m in sdf:
    if m != None:
        molid = m.GetProp('_Name')
        m.SetProp('MOL_ID', molid)
        w.write(m)
w.close()
Then I run lig3dlens-prepare command. YAML file is used for compound properties fileter which defines range of phys-chem properties which should have in each compound.
$ lig3dlens-prepare --in cdk2/actives_final_w_id.sdf --filter physchem_properties.yaml --out cdk2/actives_final_prep.sdf

 - Standardising compound library
Standardising compound library: 100%|██████████████████████████| 798/798 Calculating physchem properties for the library cmpds
Calculating physchem properties: 100%|████████████████████████| 798/798 Curated compound library stored in cdk2/actives_final_prep.sdf


$ lig3dlens-prepare --in cdk2/decoys_final_w_id.sdf --filter physchem_properties.yaml --out cdk2/decoys_final_prep.sdf
Standardising compound library
Standardising compound library: 100%|█████████████████████| 28328/28328 Calculating physchem properties for the library cmpds
Calculating physchem properties: 100%|████████████████████| 28319/28319 [00:12<00:00, 2347.09it/s]
Curated compound library stored in cdk2/decoys_final_prep.sdf
Some molecules in decoy set are removed the process above. Then I run the alignment. Current version of lig3dlens can use SMILES format only for recenrence. So user can’t provide user defined 3D structure as a reference.
$ lig3dlens-align --ref cdk2/crystal_ligand.smi --lib cdk2/actives_final_prep.sdf --conf 25 --out cdk2/actives_align.sdf
3D conformation of the reference compound has been stored in current working dir.
Conformer generation: 100%|█████████████████████████████████████| 338/338 2024-05-01 12:00:53.125 | SUCCESS  | lig3dlens.main:main:57 - 3D VS successfully terminated!

$ lig3dlens-align --ref cdk2/crystal_ligand.smi --lib cdk2/decoys_final_prep.sdf --conf 25 --out cdk2/decoys_align.sdf
3D conformation of the reference compound has been stored in current working dir.
Conformer generation:  23%|███████▉                          | 4760/20321 [06:28<25:11, 10.30it/s]2024-05-01 12:07:52.656 | ERROR    | lig3dlens.gen_conformers:generate_conformers:70 - Failed to generate 3D confs for CCC1=C(c2cccc(Cl)c2)C2=NC=C3C(=O)N(c4nnc(C)[n-]4)C=C[C@@H]3N2N1
Conformer generation:  52%|█████████████████▏               | 10590/20321 [14:54<12:44, 12.73it/s]2024-05-01 12:16:15.399 | ERROR    | lig3dlens.gen_conformers:generate_conformers:70 - Failed to generate 3D confs for CC(C)S(=O)(=O)c1cc(Br)c2c(c1)C/C(Cl)=N/c1c(Cl)ncnc1N2C
Conformer generation:  72%|███████████████████████▊         | 14630/20321 [21:41<11:00,  8.62it/s]2024-05-01 12:23:02.562 | ERROR    | lig3dlens.gen_conformers:generate_conformers:70 - Failed to generate 3D confs for CCC1=C(c2ccc(Cl)cc2)C2=NC=C3C(=O)N(c4n[nH]c(SC)n4)C=C[C@H]3N2N1
Conformer generation:  92%|██████████████████████████████▏  | 18610/20321 [28:00<01:14, 22.96it/s]2024-05-01 12:29:20.968 | ERROR    | lig3dlens.gen_conformers:generate_conformers:70 - Failed to generate 3D confs for COc1cc(I)c2c(c1)C/C(O)=N/c1c(Cl)ncnc1N2C
Conformer generation: 100%|████████████████████████████████▊| 20220/20321 [31:34<00:08, 12.38it/s]2024-05-01 12:32:56.257 | ERROR    | lig3dlens.gen_conformers:generate_conformers:70 - Failed to generate 3D confs for Cc1ccc2c(c1)=C1N=NC(SCC(=O)Nc3ccc(C)c(Cl)c3)=N[C@H]1[NH+]=2
Conformer generation: 100%|█████████████████████████████████| 20321/20321 [31:41<00:00, 10.69it/s]

2024-05-01 13:18:25.378 | INFO     | lig3dlens.alignment:run_alignment:81 - 3D overlays & calculated scores stored in cdk2/decoys_align.sdf
2024-05-01 13:18:25.406 | SUCCESS  | lig3dlens.main:main:57 - 3D VS successfully terminated!
After running the alignment process, lig3dlens provides 3 similarity score ‘SC_RDKit_Sim’, ‘ESPSim’, ‘ShapeSim’. ESPSim means electrostatic similarity and ShapeSim means shape based similarity that looks like OpenEye ROCS score.
Then I checked the score perfomance with some plots.
https://gist.github.com/iwatobipen/469ab32dc7d02b2738ce457ca8d38acd
Unfortunately the result is not so good. Hmm I used 25 as a num_conformers and it little bit small…
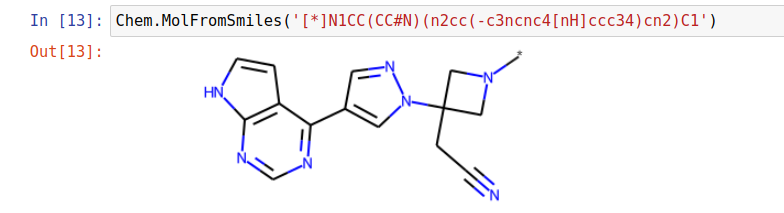
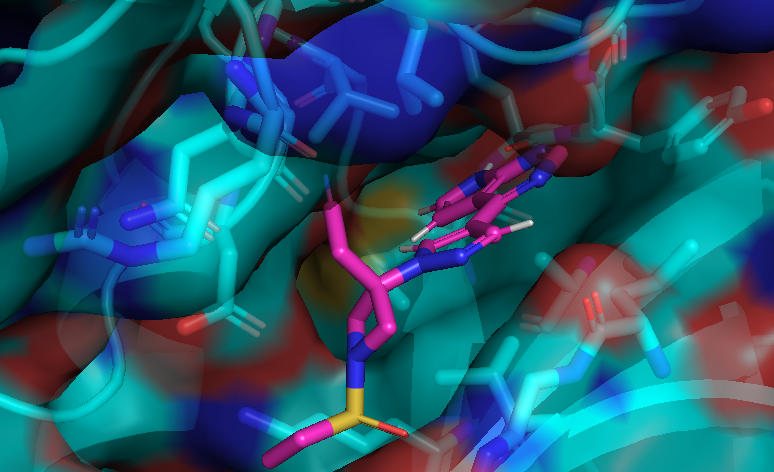
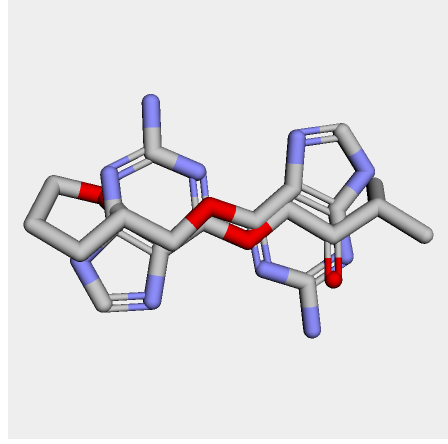
I cheked reference 3d structure becase the structure is build from SMILES. so it’s not same as biological active pose. Here is a mcsaligned pose of reference compound. Sky blue is structure from crystal and magenta is structure from SMILES with rdkit.

The dihedral angle of central heteroaromatic ring and di-Cl phenyl ring seems more flat than biological active pose. Di substituted ring should not be flat IMHO but over all pose of two ligands well aligned.
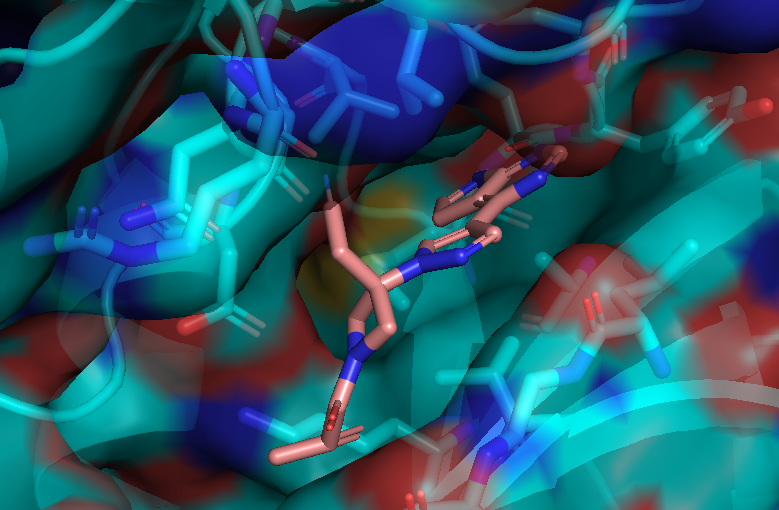
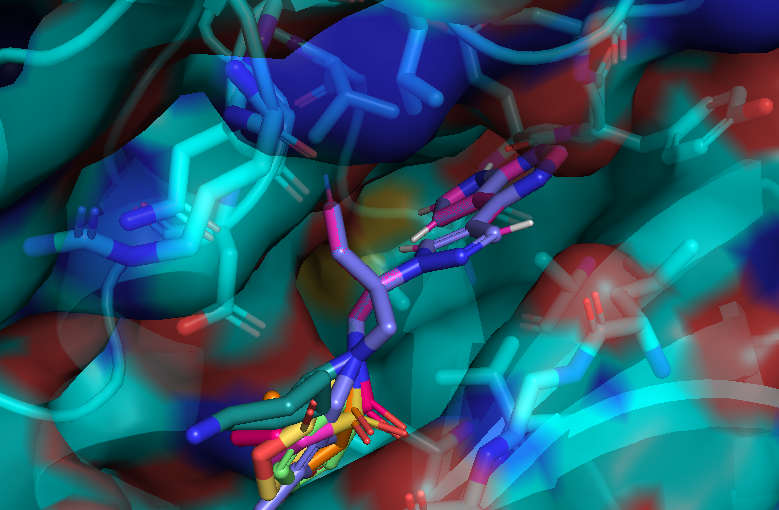
Here is an aligned pose of active dataset to reference molecule.

Decoys set is too large to load pymol. So it limited active compound set on the blog post. Some compounds seem well aligned.
Lig3Dlens is easy to use and useful for LBVS I think but today’s experimant did not work well ;P I would like to modify experimental settings and try again.