Yesterday, I posted about quantum chemistry based predictive model named ‘torch-ani’. It’s really interesting module which build from lots of QC data. To use torchani API, we can visualize torsion drive with the trained model. It sounds interesting however, I would like to compare the torsion drive results from different approaches.
Fortunately, QCArchive provides very useful data and code. To use qcportal package, I could access some data source which is ready to visualize.
So I tried to get data and visualize them. Most of the following code is same as qcarchive example code. But different to data source. OK let’s do it. I used rdkit for compound visualization. And qcportal is used retrieving data and visualize the results. At first import packages and connect portal site.
from rdkit import Chem
from rdkit.Chem import Draw
from rdkit.Chem import AllChem
from rdkit.Chem.Draw import rdDepictor
from rdkit.Chem.Draw import IPythonConsole
from rdkit.Chem import PandasTools
import py3Dmol
import copy
rdDepictor.SetPreferCoordGen(True)
from IPython.display import display

# ref https://qcarchivetutorials.readthedocs.io/en/latest/basic_examples/torsiondrive_datasets.html
import qcportal as ptl
client = ptl.FractalClient()
client

> FractalClient
> Server:   The MolSSI QCArchive Server
> Address:   https://api.qcarchive.molssi.org:443/
> Username:   None
Then I used “TorsionDriveDataset”, “OpenFF-benchmark-ligand-fragments-v1.0” dataset. This data set has torsion drive data which is calculated with different parameters such as openff, gaff, and ani2x. I got data which has ani2x results only. And added rdkit molobject to the dataframe.
ds = client.get_collection("TorsionDriveDataset", "OpenFF-benchmark-ligand-fragments-v1.0")

ani2xcomdf = ds.status('ani2x',collapse=False, status="COMPLETE")
ani2xcomdf['Mol'] = ani2xcomdf.index.to_list()
PandasTools.AddMoleculeColumnToFrame(ani2xcomdf, smilesCol='Mol', molCol='Mol')
ani2xcomdf['RowID'] = [i for i in range(ani2xcomdf.shape[0])]

ani2xcomdf

Now ready, when I call ds.visualize method with some arguments, I could visualize torsion drive data. To visualize some dataset, I used for loop. It’s really simple code.
import time
for idx in range(ani2xcomdf.shape[0]):
    print("######################################")
    display(ani2xcomdf.Mol[idx])
    m = copy.deepcopy(ani2xcomdf.Mol[idx])
    mh = Chem.AddHs(m)
    AllChem.EmbedMolecule(mh)
    m = Chem.RemoveHs(mh)
    display(IPythonConsole.drawMol3D(m))
    ds.visualize(ani2xcomdf.index.to_list()[idx],
           ['openff-1.0.0', 'ani2x'],
           units="kcal / mol")
    time.sleep(5)
    print("######################################")
The code iterate ani2xcomdf, and visualize the torsion drive of each row of ‘openff’ and ‘ani2x’.
It’s interesting that some compounds data showed very similar trend but some compounds showed quit different result.
Here are some examples….


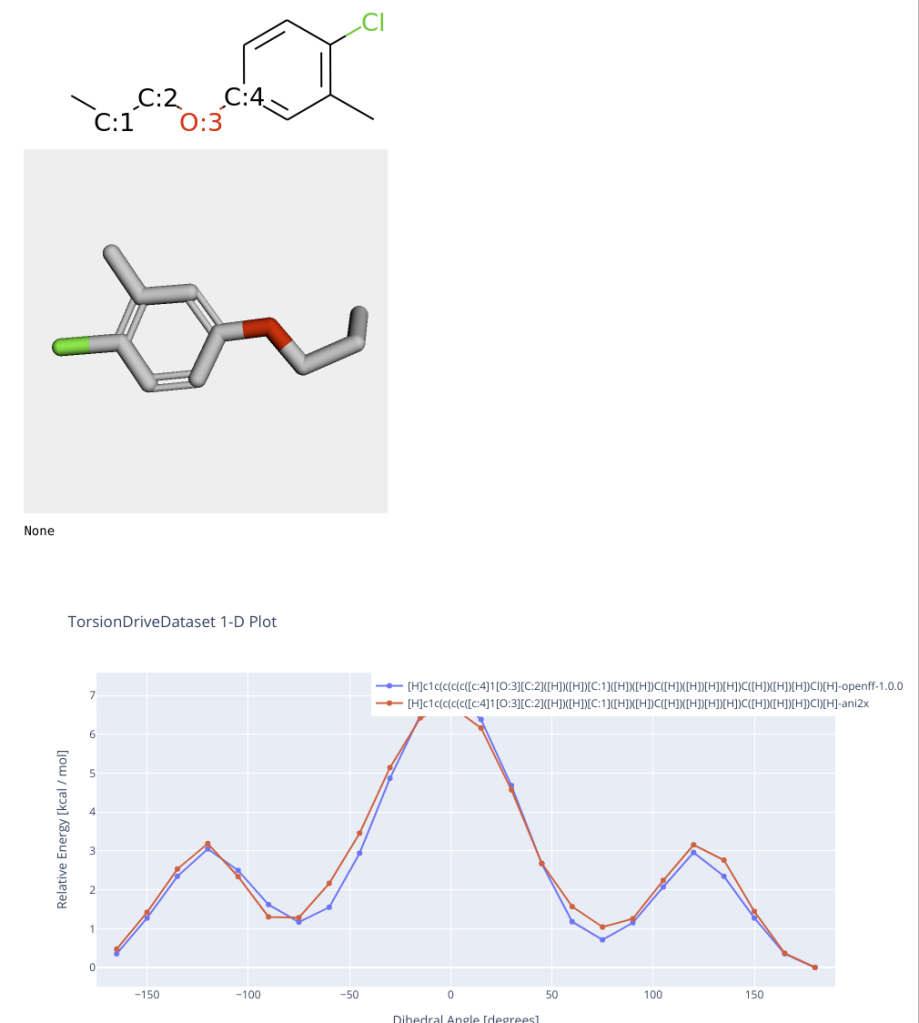


I think that the simple example shows machine learning based approach is not perfect but works well if target molecules are in applicability domain(AD). It depends on training data.
I would like to check the training data of ani2x and compare molecules which are used in above code.
Today’s code was uploaded to my gist.
https://nbviewer.jupyter.org/gist/iwatobipen/8afaba7236cb725b8ce2cb47d5286286
